
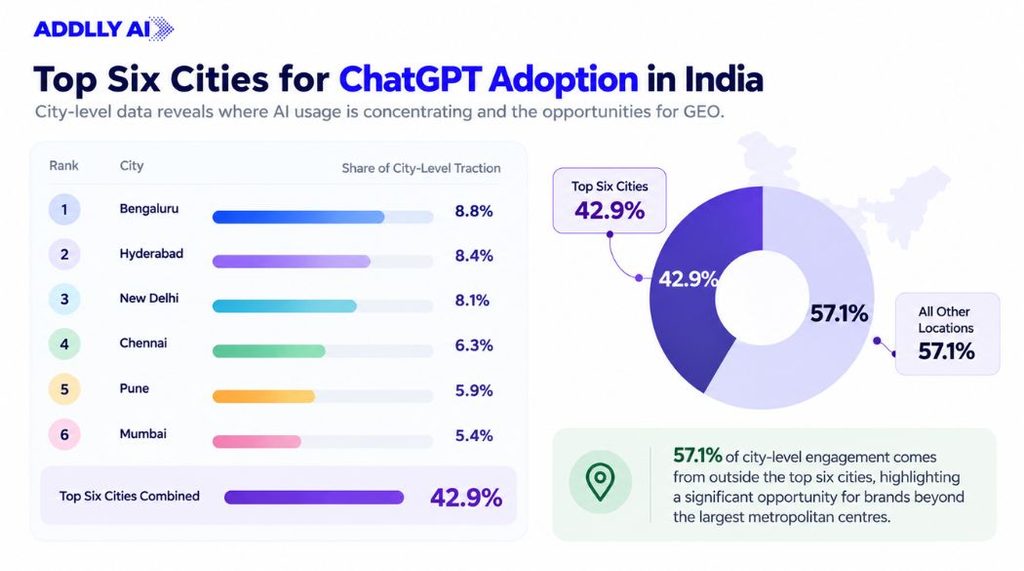
India’s ChatGPT adoption is concentrated in a few major cities, but most observed traction comes from beyond them. Our analysis of aggregated and anonymised engagement patterns shows that Bengaluru, Hyderabad, New Delhi, Chennai, Pune and Mumbai together account for 42.9% of city-level traction, while the remaining 57.1% comes from locations outside these six cities.
This creates a more nuanced picture of AI adoption across India. The country has a strong concentration of activity around technology and knowledge-economy hubs, but a substantial regional audience is emerging alongside them. For brands trying to understand where they stand in this changing search environment, a GEO audit can help identify where their brand appears across AI search and where visibility gaps exist.
The finding also has implications beyond organic AI visibility. As more audiences use ChatGPT for discovery, research, and recommendations, brands have another opportunity to reach them through ChatGPT Ads, particularly when they want to complement their organic AI visibility with paid placement
Quick Summary – India’s ChatGPT Adoption Map
- India’s AI engagement has a strong urban core, led by Bengaluru, Hyderabad, New Delhi, Chennai, Pune and Mumbai, accounting for 42.9% of city-level traction.
- AI engagement extends well beyond the largest metropolitan markets, with 57.1% of city-level traction coming from outside the top six cities.
- Technology hubs remain important AI adoption centres, with Bengaluru, Hyderabad, Chennai and Pune together accounting for 29.4%.
- South India contributed 39.7% of state-level traction across Karnataka, Tamil Nadu, Telangana, Kerala and Andhra Pradesh.
- Uttar Pradesh showed a distributed adoption pattern, contributing 14.2% without one city dominating its state-level traction.
- AI adoption creates a market-level GEO opportunity, making city and regional AI visibility increasingly relevant for brands.
What Does ChatGPT Adoption Look Like Across India?
Our analysis shows that ChatGPT engagement is concentrated in several major urban markets, but the broader picture is more distributed than the top-city rankings suggest. Looking at both city- and state-level patterns reveals two distinct characteristics of AI adoption in India: strong urban concentration and a substantial regional tail.
The Biggest Cities by Traction
The top six cities alone account for 42.9% of observed city-level traction, with Bengaluru and Hyderabad leading the distribution. The presence of Chennai and Pune in the top group also reinforces the role of technology and knowledge-economy hubs.
The Leading States by Traction
The state-level distribution tells a slightly different story. Maharashtra and Uttar Pradesh lead, while Karnataka, Tamil Nadu, and Telangana also show substantial levels of observed ChatGPT engagement.
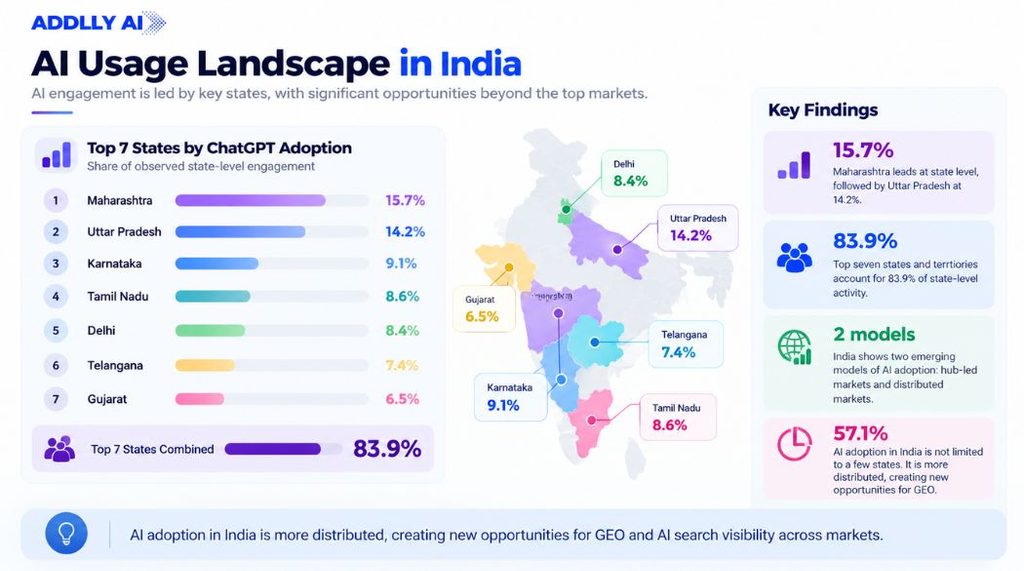
This matters because a state can have strong overall traction without having a single city dominating its distribution. Uttar Pradesh is a particularly clear example of this pattern.
57.1% from the Rest of India
The other 57.1% is spread across cities outside the top six. That creates what the data describes as a concentrated head and a very large regional tail.
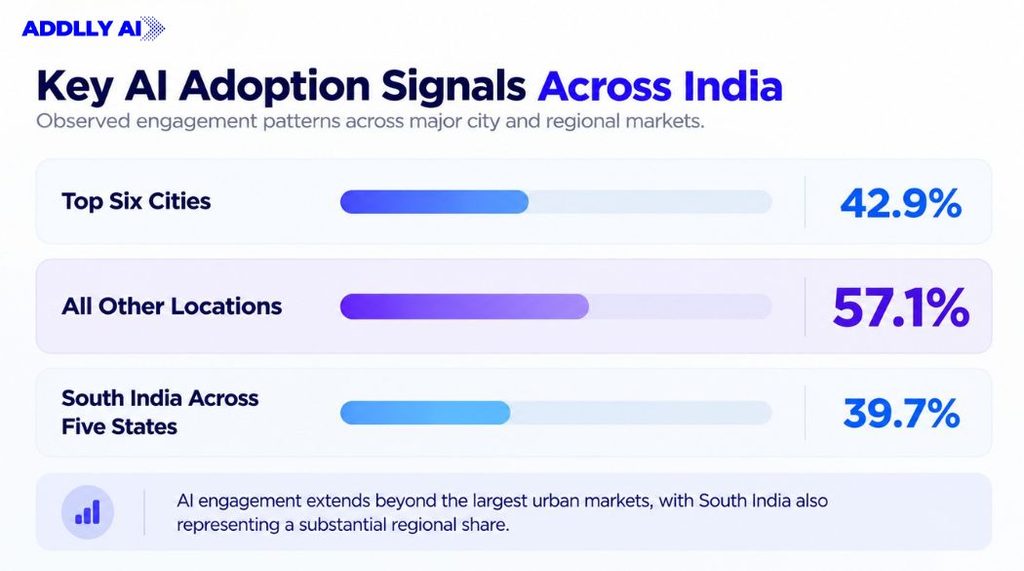
Data implication: The 57.1% outside the top six shows that ChatGPT adoption in India extends well beyond the largest metropolitan centres, creating a substantial regional market alongside the concentrated urban core.
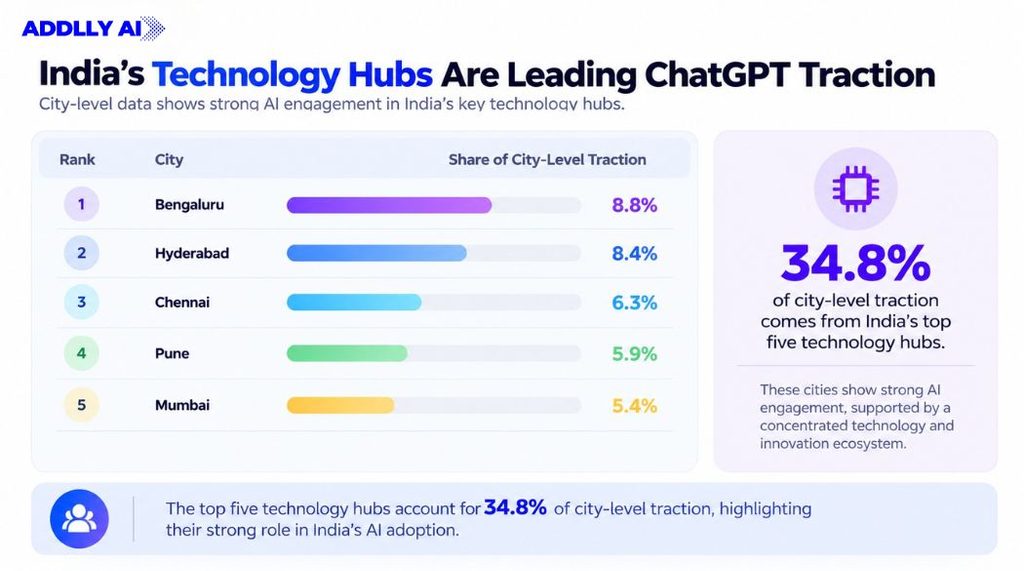
India’s Technology Hubs Are Leading ChatGPT Traction
India’s strongest technology and knowledge-economy centres show a distinct concentration of ChatGPT engagement. Bengaluru, Hyderabad, Chennai and Pune stand out not just individually, but as a connected group of markets where technology-intensive ecosystems are already well established.
What the Technology-Hub Concentration Tells Us
The significance of this pattern goes beyond the individual city percentages. These four markets collectively represent 29.4% of observed city-level traction, suggesting that existing technology and knowledge-economy ecosystems may be important environments for AI adoption.
For brands operating in these markets, the question is therefore not only whether people are using AI, but whether the brand is visible when those audiences turn to AI for information, comparison, and discovery. This makes AI search visibility an important dimension of market-level digital visibility.
The broader pattern points toward an emerging technology-hub effect, where established digital ecosystems can become important centres of AI adoption.
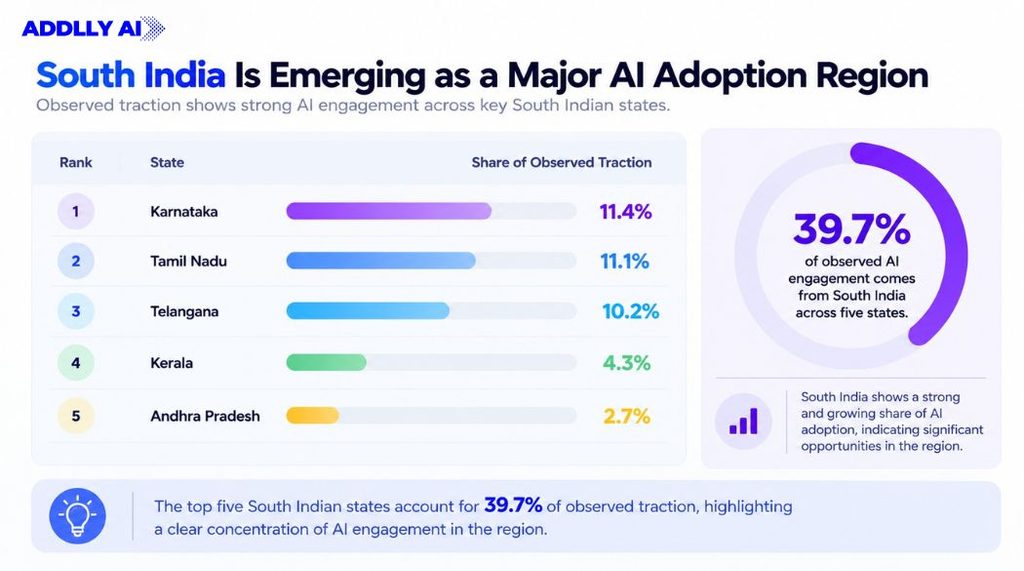
South India Is Emerging as a Major AI Adoption Region
South India presents one of the clearest regional patterns in the data. Karnataka, Tamil Nadu, Telangana, Kerala and Andhra Pradesh together account for 39.7% of observed state-level traction. But treating these states as a single AI market would overlook important differences in how adoption is distributed within each one.
Why South India Cannot Be Treated as One Market
The combined figure is significant, but the underlying structures are different. Bengaluru accounts for roughly 77% of Karnataka’s state-level share, while Hyderabad represents roughly 82% of Telangana’s. Tamil Nadu, by comparison, has a more distributed pattern across its cities.
That difference matters for brands building regional AI visibility. A strategy built around one dominant city may make sense in one state, while another may require visibility across several urban markets and different forms of local search intent.
This makes GEO strategy increasingly relevant when brands need to adapt AI visibility efforts to different markets rather than treating an entire region as one audience.
The broader lesson is simple: South India is a major AI adoption region, but it is not a single AI market.
Uttar Pradesh Shows a Different Pattern of AI Adoption
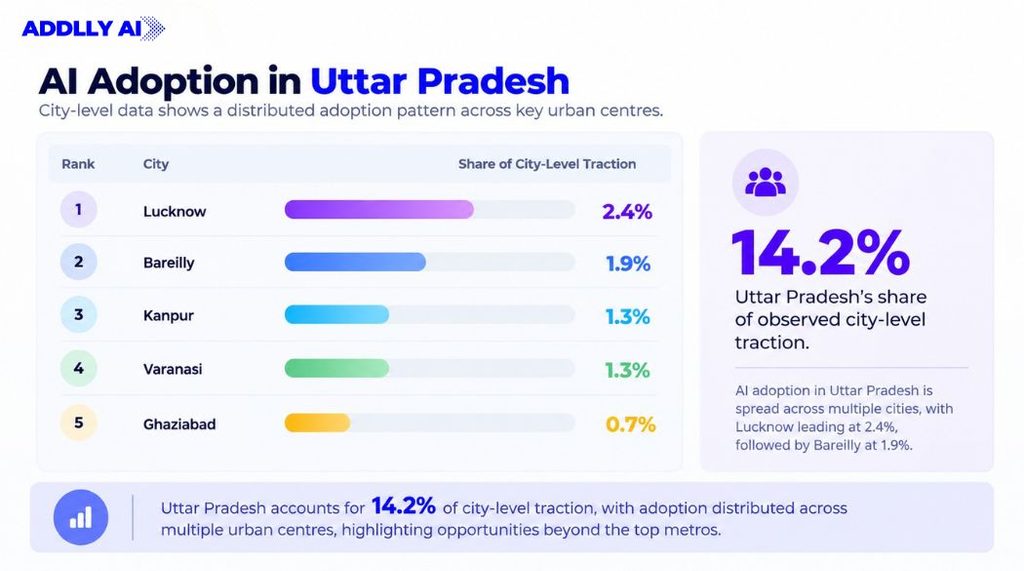
Uttar Pradesh stands out because its 14.2% state-level traction does not come from one dominant city. Instead, the activity is distributed across several urban centres, creating a very different pattern from the hub-led concentration seen in Karnataka and Telangana.
Why No Single UP City Dominates
The distribution across Lucknow, Bareilly, Kanpur, Varanasi, Ghaziabad, and other cities suggests that Uttar Pradesh’s AI adoption is geographically distributed rather than concentrated around one primary hub.
This creates an interesting contrast with states where one city accounts for most of the observed state-level activity. The UP pattern indicates that regional cities can collectively contribute substantial AI engagement even without a single city reaching the scale of Bengaluru or Hyderabad.
Hub-Led vs. Distributed AI Adoption
The data points to two different models emerging across India:
| Model | Example | Pattern |
| Hub-led adoption | Karnataka, Telangana | One major city accounts for a large proportion of state activity |
| Distributed adoption | Uttar Pradesh | Multiple cities contribute to the state’s overall activity |
For brands, this distinction changes how geographic AI search visibility can be approached. A market with several meaningful regional centres may require visibility across a broader set of locations rather than focusing primarily on one metropolitan hub.
Uttar Pradesh therefore provides an important counterpoint to the technology-hub model: AI adoption can scale through a network of regional cities, not just through one dominant urban centre.
Are Tier-1 Cities Still the Best Way to Understand AI Adoption?
The city-level data starts to challenge the idea that AI adoption can be understood through India’s traditional Tier-1 hierarchy. Several regional cities show meaningful ChatGPT traction, suggesting that AI readiness may be a more useful lens than conventional city classifications.
Regional Cities Show Broader AI Engagement
AI engagement is not limited to the largest technology hubs. Several regional cities show meaningful shares of observed ChatGPT traction, reinforcing the broader geographic distribution of AI usage across India.
Chandigarh, Ahmedabad and Jaipur
Chandigarh, Ahmedabad and Jaipur show that significant AI engagement extends beyond the country’s largest technology hubs.
| City | Share of City-Level Traction |
| Chandigarh | 4.3% |
| Ahmedabad | 3.7% |
| Jaipur | 3.1% |
Their presence suggests that regional markets can develop meaningful AI engagement without being India’s dominant technology centres.
Lucknow, Coimbatore and Kochi
The pattern continues across other regional cities, including Lucknow, Coimbatore and Kochi.
| City | Share of City-Level Traction |
| Lucknow | 2.4% |
| Coimbatore | 1.9% |
| Kochi | 1.8% |
These markets add to the evidence that AI adoption is not confined to India’s biggest metropolitan centres.
The Rise of AI-Ready Regional Cities
The more useful question may therefore be what makes a city AI-ready, rather than which traditional tier it belongs to. Factors such as knowledge-economy density, digital behaviour, AI discovery maturity and local commercial activity can provide a more nuanced way to understand emerging AI markets.
For brands, this also creates a measurement challenge. Regional opportunities can remain invisible if AI visibility is assessed only at a national level. It becomes increasingly important to measure brand visibility in AI search across the markets that matter to a business.
Where Does India’s AI Audience Sit Demographically?
The city-level data gives us useful clues about where AI engagement is concentrated, but it does not provide a direct demographic profile of the people behind that activity. Instead, the geography allows us to examine the ecosystems surrounding higher levels of observed ChatGPT traction, including urbanisation, digital maturity, knowledge-intensive industries and economic activity.
Urban vs. Regional Audiences
The data shows both strong metropolitan concentration and meaningful activity beyond the largest cities. The top six cities account for 42.9% of observed city-level traction, but 57.1% comes from locations outside those six markets.
That creates a useful distinction between India’s major urban AI hubs and its broader regional AI audience. ChatGPT engagement is clearly not limited to the country’s biggest metropolitan centres.
Digital Maturity
Many of the cities appearing prominently in the data have established digital ecosystems and relatively strong technology infrastructure. Bengaluru, Hyderabad, Chennai and Pune, for example, are major technology and knowledge-economy centres.
The data therefore shows a relationship between AI engagement and digitally mature urban ecosystems, although it does not establish that digital maturity alone causes higher ChatGPT usage.
Technology and Knowledge-Economy Concentration
Technology and knowledge-intensive industries form another important contextual factor. Bengaluru, Hyderabad, Chennai and Pune together account for 29.4% of observed city-level traction.
This concentration may reflect environments where professionals and businesses already interact heavily with digital tools, software platforms and information-intensive workflows.
Education and Professional Ecosystems
Cities with large professional, educational, and knowledge-based ecosystems also appear across the dataset. These environments can support frequent information seeking, research and experimentation with emerging technologies.
However, the geographic data alone cannot tell us the education level, occupation or professional background of individual ChatGPT users. Those characteristics would require separate demographic research.
Income and Economic Activity
Economic activity provides another useful contextual lens. Several high-traction cities are major commercial and employment centres, while regional markets also contribute meaningful engagement.
The important distinction is that city-level ChatGPT traction should not be interpreted as a direct measure of income or purchasing power. A higher share of observed engagement does not, by itself, establish that users in that location have higher incomes or greater spending capacity.
What the City Data Reveals About Indian Consumer Behaviour
The geographic patterns suggest that AI is becoming part of how people discover information, research options, and compare alternatives. The concentration across technology hubs and regional cities points to AI-assisted discovery extending beyond traditional search behaviour.
As users move from basic information queries to recommendation-led searches and purchase-intent questions, AI can increasingly influence the consideration stage of the consumer journey. This makes visibility within AI-generated answers relevant alongside traditional search rankings.
For brands, the shift creates a new layer of consumer discovery to measure. Understanding AI search purchase intent can help connect geographic AI adoption with the types of queries that may influence decisions.
What India’s AI Adoption Map Means for Brands
The city-level pattern shows why a single national AI visibility number can hide important differences between markets. A brand may have strong overall visibility while remaining less visible in specific cities or regions where AI engagement is developing differently.
Why National-Level AI Visibility May Not Be Enough
National visibility provides a broad picture, but it does not show where a brand is being surfaced in AI answers. The concentration and distribution of ChatGPT engagement across Indian cities suggest that brands need to look at visibility at a more granular market level.
Market-Level GEO
Market-level GEO means looking beyond overall AI visibility and understanding how a brand appears across specific geographic markets. This becomes particularly relevant when adoption is concentrated differently across states and cities.
Local Consumer Intent
The same product or service can generate different questions across markets. Understanding local intent can therefore help brands identify what audiences are asking AI, what they are comparing, and where their information needs differ.
Regional Language and Search Behaviour
India’s regional diversity also means that AI discovery cannot be viewed purely through English-language behaviour. Local language preferences and regional search patterns can influence how people formulate questions and interact with AI.
City-Level AI Visibility
The final layer is city-level visibility. The data shows that AI engagement exists well beyond the largest metropolitan centres, creating opportunities to understand where a brand appears, where it is absent, and how visibility varies across markets.
The broader implication is a shift from national AI visibility to market-level AI visibility, giving brands a more granular way to understand their presence in India’s evolving AI search landscape.
What Do These AI Adoption Patterns Mean for Brands?
The data points to a shift in how brands should think about AI visibility in India. National-level visibility provides only part of the picture. The stronger opportunity comes from understanding where AI engagement is concentrated and how that concentration differs across markets.
1. High-Adoption Markets Need Stronger AI Visibility
Bengaluru, Hyderabad, New Delhi, Chennai, Pune and Mumbai account for 42.9% of observed city-level traction. These markets represent a concentrated opportunity for brands competing for AI-assisted discovery.
The implication is simple: brands should know whether they are visible in the markets where ChatGPT engagement is already strongest.
2. Regional Markets Should Not Be Treated as Secondary
The remaining 57.1% of city-level traction comes from outside the top six cities. This makes it difficult to treat AI adoption as an exclusively metro-driven behaviour.
Brands targeting India therefore need visibility strategies that extend beyond the largest urban centres.
3. One GEO Strategy May Not Fit Every Market
The data shows different adoption patterns across India. Karnataka and Telangana demonstrate stronger concentration around Bengaluru and Hyderabad, while Uttar Pradesh shows a more distributed pattern across several cities.
This suggests that AI visibility should be evaluated at a market level, rather than assuming that national visibility reflects every region equally.
4. Adoption Data Can Help Prioritise GEO Efforts
The map can help brands identify where to look first. A market with strong ChatGPT engagement but weak brand visibility may represent a more immediate GEO opportunity than a market where both adoption and visibility are already strong.
5. AI Visibility Needs a Geographic Lens
The biggest takeaway is that AI adoption and AI visibility should be analysed together. Knowing where people are engaging with ChatGPT can help brands decide where to measure visibility, identify gaps and prioritise GEO activity.
What Does ChatGPT Adoption in India Mean for GEO?
India’s ChatGPT adoption map suggests that GEO needs to move beyond a national visibility score. If AI engagement varies across cities and states, brands need to understand where their visibility is strong, where gaps exist, and which markets are seeing greater AI adoption.
That makes the connection between AI adoption and brand visibility increasingly important. A market with strong AI adoption but limited brand visibility could represent a gap that a national-level GEO view might miss. Looking at these patterns market by market gives brands a clearer picture of where their AI search presence stands.
For brands ready to act on this, the process can start with how to run a GEO audit, which helps establish the current state of AI visibility before deciding where to invest further. Addlly AI can then take that analysis into ChatGPT Ads, supporting the process from GEO auditing and visibility analysis through ChatGPT Ads setup and execution.
Research Methodology
This analysis uses aggregated and anonymised ChatGPT engagement patterns across Indian cities and states to understand where observed AI engagement is concentrated. The data is examined at both city and state levels to identify patterns of concentration, regional distribution, and emerging AI adoption models.
The analysis focuses on geographic engagement patterns, comparing major cities, regional markets and states rather than treating India as one uniform AI audience. This helps identify patterns such as technology-hub concentration, distributed adoption and regional AI engagement.
The percentages represent directional indicators of observed ChatGPT engagement, not official population-level ChatGPT penetration rates. The data also does not provide individual-level demographic information, including users’ age, gender, occupation, income, or purchasing power. These findings should therefore be interpreted as geographic AI adoption patterns, not individual user profiles or a demographic census.
FAQs – India’s ChatGPT Adoption Map
Which Indian City Has the Highest ChatGPT Traction?
Bengaluru has the highest observed city-level ChatGPT traction at 8.8%, followed by Hyderabad at 8.4% and New Delhi at 8.1%.
Which Indian State Has the Highest ChatGPT Traction?
Maharashtra has the highest observed state-level traction at 15.7%, followed by Uttar Pradesh at 14.2% and NCT Delhi at 11.6%.
Are Technology Hubs Driving ChatGPT Adoption in India?
The data shows strong concentration across technology and knowledge-economy hubs. Bengaluru, Hyderabad, Chennai and Pune together account for 29.4% of observed city-level traction, indicating a notable technology-hub effect.
Is ChatGPT Adoption Concentrated Only in Tier-1 Cities?
No. While major metropolitan areas account for substantial traction, 57.1% of observed city-level traction comes from locations outside the top six cities. Regional markets such as Chandigarh, Ahmedabad, Jaipur, Lucknow, Coimbatore and Kochi also show meaningful traction.
How Is AI Adoption Different Across Indian States?
The distribution varies considerably. Karnataka and Telangana show strong concentration around Bengaluru and Hyderabad, while Uttar Pradesh has a more distributed pattern across cities such as Lucknow, Bareilly, Kanpur and Varanasi.
What Does ChatGPT Adoption Mean for Indian Brands?
The geographic pattern suggests that brands may need to look beyond national AI visibility and understand how their presence varies across different markets. High-adoption markets can provide useful context for evaluating AI search visibility and potential visibility gaps.
Why Does City-Level AI Adoption Matter for GEO?
City-level adoption helps show where AI engagement is concentrated and where regional opportunities may exist. It can provide a more granular perspective for GEO, particularly when combined with market-level brand visibility data. The geographic data itself, however, does not establish individual user demographics or behaviour.

